Here’s Your 5-Part Checklist That Will Help ANY Forex Trader Stay Profitable

Forex Jargon 101: How To Read Currency Pairs What are Lot-Sizes, Pips & Pipettes
February 3, 2020
How to Spot a Fake Forex “Guru” On Social Media
March 12, 2020How to Spot a Great Trade and When to Stay Out of the Markets So You Don’t Lose Any Money
One of the biggest mistakes any Forex Trader can make is entering a trade a little too early, a little too late, at the wrong time and the wrong price point. Like anything in life, positioning yourself properly through understanding and discernment is one of the most important skillsets you can develop. SO the question we aim to answer in this article is: How to spot a trade and when you should completely stay out fo the markets so you don’t lose more money than you make.
But first…We have a few things to talk about,
As a Forex Trader, you have to develop a certain level of understanding, a certain level of maturity to play the long game. By playing your probabilities over a long period, you WIN always. Not because you win every trade or even the majority of trades, but because you develop a few key skills and personal rules for trading that make you effective and profitable.
Can one trade make you a lot of money? Of course, but one trade can also lose you a lot of money and typically, most traders lose more money than they make over long periods. Not because they aren’t great “traders,” but because they are terrible managers. They neglect to manage their emotions, risk, and finance.
As Peter Brandt (a highly regarded commodities trader) once put it,
A great technical analyst cannot always be a good trader. A good trader is a good risk manager. It is what makes them a good trader. Trading and analysis are two different skill sets. A tiny percentage of traders possess both capabilities.
Now you understand why so few people make money in these markets. Not because few people can learn these skills, but because few people take the time to.
One pure example, of this, would be in athletics. Typically you will have someone who’s the number one or two pick in a league and they’re expected to do big things. Then over a few seasons, we witness their professional careers fizzle out. And that’s when some other athlete who was a “no-namer” 2nd or third-round pick slowly rises to prominence. Why is that? Well, they continue to show up where the number one seed may have gotten lazy or injured, and typically they just want it more.
So without further ado, I want to dive into 5 components that you can almost treat like a checklist to success that will help you determine whether or not you should take a position in a trade or stay out of the markets.
1. Patience – Was I Patient?
The majority of novice traders learn how to “spot patterns” and use “technical indicators” for the first time and they get excited because they believe they know where the market is moving and their “charting” supports their theory so they enter a trade that moment. Major mistake. Don’t try and force a trade. Wait for opportunities to come to you. Staying flat in the market is better than losing capital. Always ask yourself are you entering because you’re excited or exiting because you’re fearful? Could you possibly stand to wait another day or two to see what happens before making a decision?
As a wise man once shared, “Money will ALWAYS move from the hands of the impatient to the hands of the patient.”
2. Trend Determination – Do I Know The Trend?
If you learn nothing else of trading, I believe adhering to this one principle is the best way for anyone to make money in any market, whether it’s Forex, Stocks, Commodities or Futures.
Spot whether the trend is bearish (going down) or bullish (going up) remember the trend is your friend. The best way to know the trend is to look at the charts on higher timeframes. Weekly and monthly charts are a great place to start because it will give you a bigger picture and perspective. What may seem like a “big” move on a 4-hour chart (which can scare you out of a trade or FOMO you into one) won’t affect you if you know the overall trend.

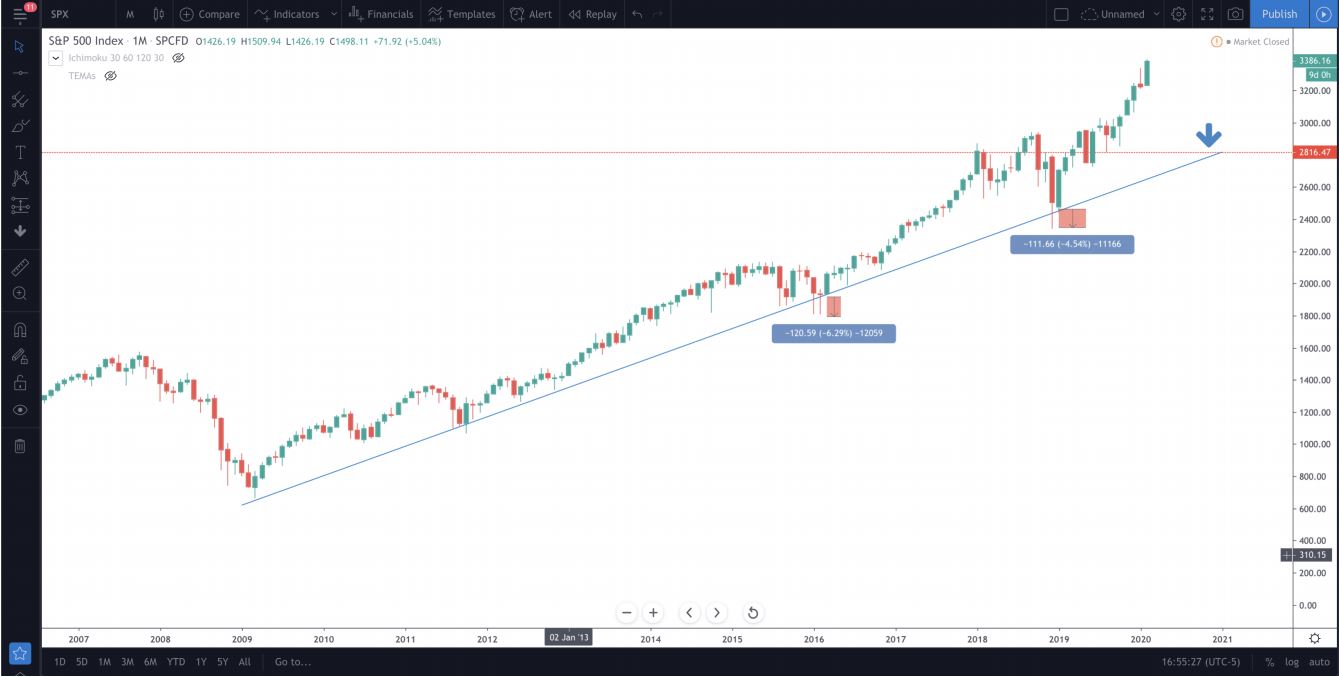
Determining a trend is very simple, just draw one straight line on a chart like the one below, which is the S&P 500 on a monthly timeframe.
As you can see the trend is up and at a few points the candles “wicked” down about 4 – 6% but then moved back above the trendline to maintain the upward momentum. In other words, a good time to buy would have been at the beginning of the month when the candle closed above the trend.
I understand this is not a “Forex Market” but this trend was easy to spot and a good example + Visual. The same principles apply to these markets.
It’s also important to note that “trend trading” depends on what Kind of a trader you want to be. To determine what kind of a trader you are, Click Here to Check Out a Previous Article Titled:
3. Key Levels – Whats A Good Key Level I Can Enter At?
Most of the time, especially when we’re new to Forex Trading, we want to enter a trade NOW, because we want to make money NOW. This all comes back to being patient and waiting for the market to come to you before you enter a position. Wait for price to approach a key level, don’t enter prematurely. This comes back to patience.
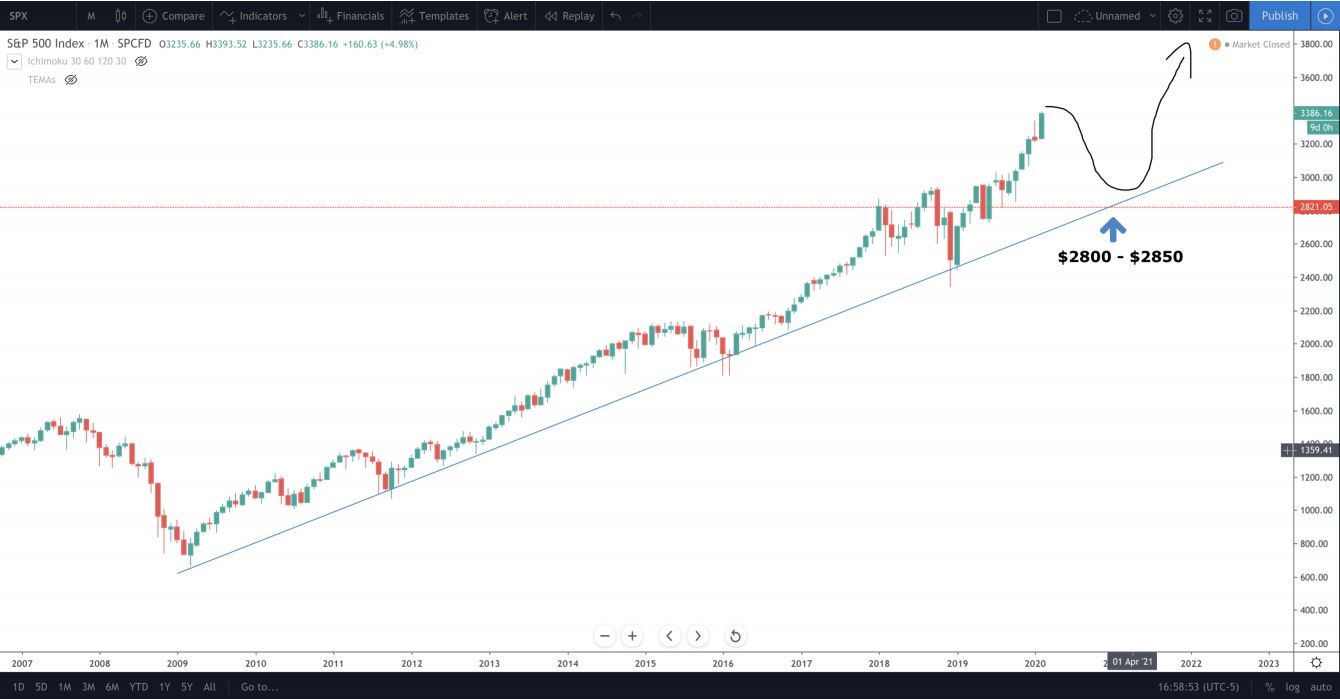
Take the example above: If you buy into the last price and Long the market because you believe it may go up (because that’s what the trend is doing) you’re likely right. However, it could also go down, so instead of entering right now, why not wait for the price to fall back down to a key level before entering? Check out the graph below.

You can see that 2800 has been traded at and hit multiple times over months so even if the market had a 20% drop (equivalent to $6,000) the price would still maintain that trend. In other words, $2800 – $2900 would be a phenomenal opportunity to buy in and long the market
4. Price Patterns – Is There Previous Price-Action History That Supports My Idea/Trade?
A question you have to ask yourself is: Do I know how this particular pair I’m about to tradereacts and responds? Does it happen frequently? rarely? Has it been the price I think it’s going to go to before? How long? Did it maintain that price?
When it comes to relationships, especially someone whose proven to be unfaithful oruntrustworthy, you don’t listen to what they say, you look at what they do. You look at history and your likelihood of determining their future actions improves dramatically. Not always, but most of the time. When it comes to technical analysis and charts, its the same thing. History helps us determine future outcomes. Look out for potential price patterns to refine your entry. One way to do this accurately is by drawing “support” and “Resistance” lines.
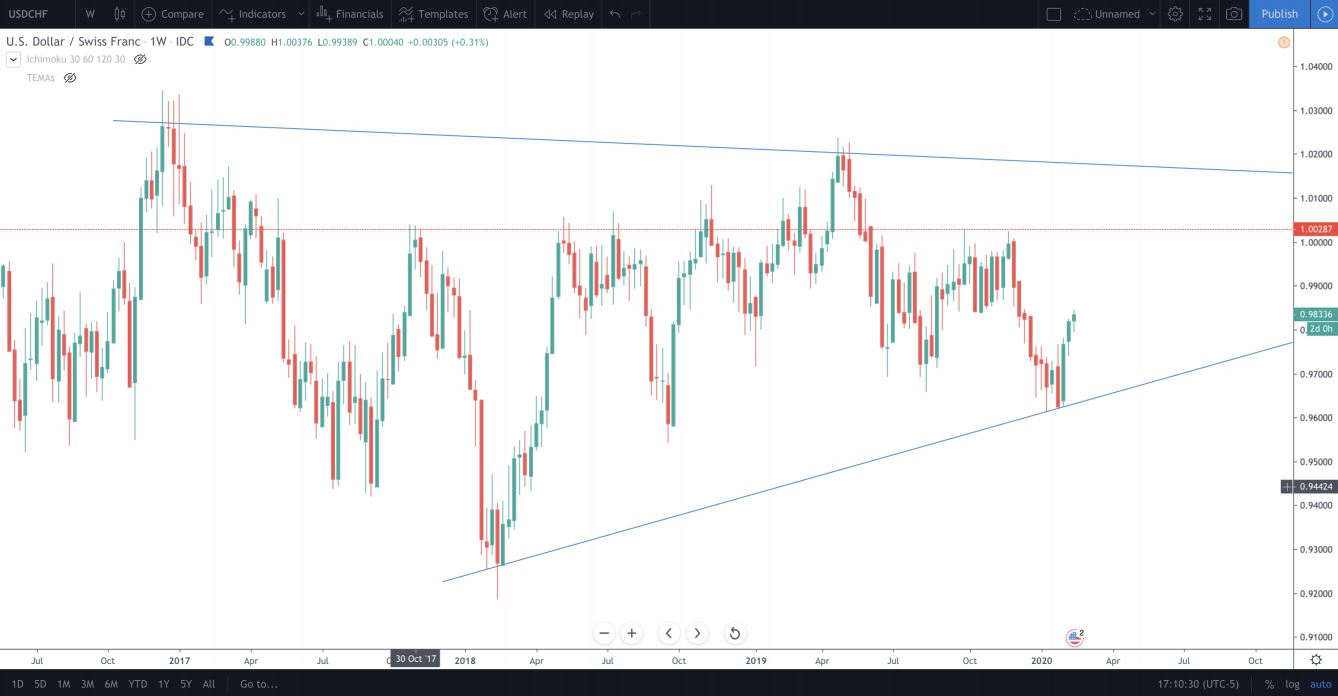
Below I have the USD/CHF pair on a weekly chart.

The blue lines denote a “wedge” pattern. The bottom blue line could be denoted as a “support line” and the top blue line would be considered a “resistance line” because price failed to move beyond it multiple times. The dotted red line looks to be another resistance line because the price failed to move above it upwards of 8 times and then when it finally did it went all the way up to the top blue line before moving back below the red line. It seems that the wedge is a stronger representation of “support and residence” than the red line; however, you can trade both.
From where price currently stands, it seems highly probable that price will reach the red line and face some “resistance” then.
5. Risk Management – If I’m Right In My Prediction, Where Will I Take Profit? If I’m Wrong, Where Will I Place My Stop Loss?
BEFORE execution, determine your PRECISE invalidation and size your position accordingly. A topic that I never fail to mention because it is easily one of the most (if not THE most important) discipline you can adopt as a trader.
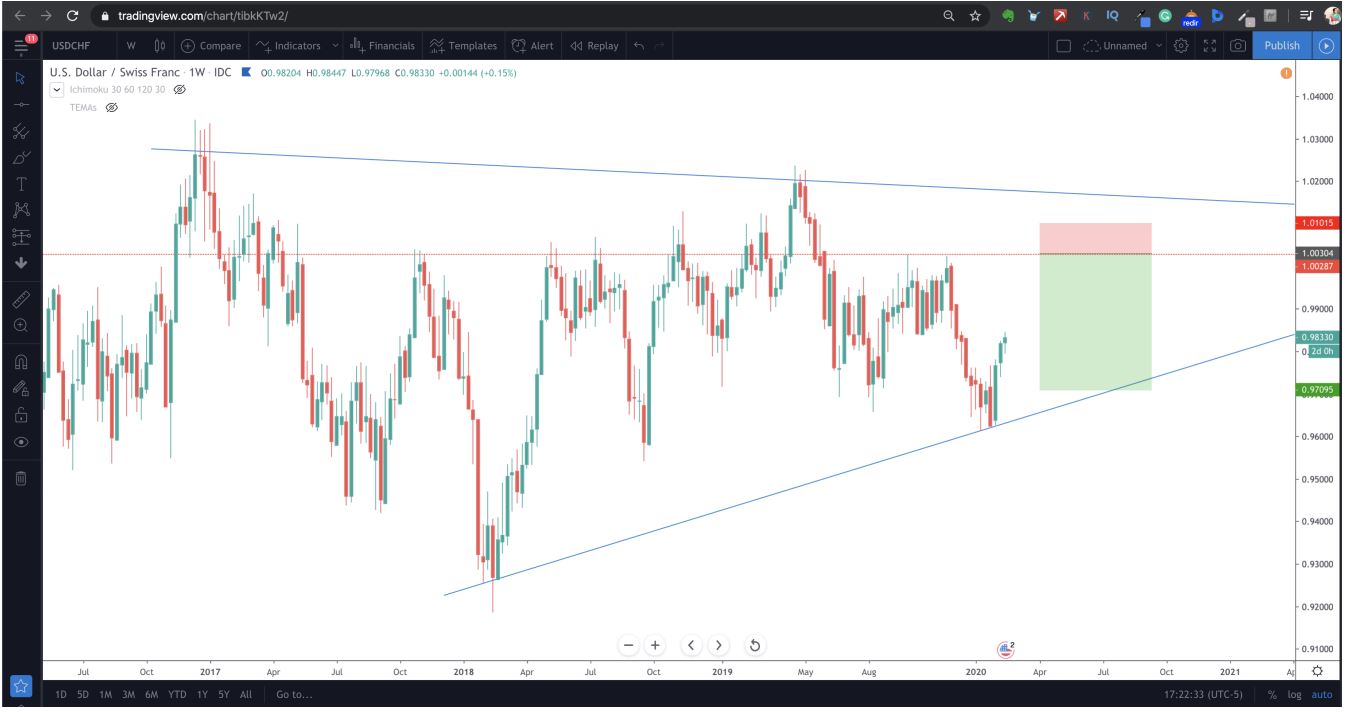
To further the example above, we have identified a great place to “short” the market for a 4.5 to 1 reward to risk ratio.

When the price reaches 1.00, we place a “sell order” because we believe the market is moving down. If the market begins to move down when it reaches that level we’re likely right and it will continue down to .97 and if we’re wrong, it will likely move to 1.016 or beyond. So for that reason and to protect ourselves from a bigger loss, out “stop-loss” is placed at 1.01


