Forex Trend Trading 101

The Art of Using Artificial Intelligence (A.I.) To Trade Forex
March 12, 2020
How to Make Money Trading Forex During the 2020 Recession
April 8, 2020How To Spot Forex Market Trends, Trade Trends, And Recognize
When the Trend is About to End So You Don’t get Wrecked or Caught Off-Guard
Trading Forex is a ZERO-Sum Game. If you make money, then that means some other guy lost money. On the flip side, if you lost money, that means some other A-hole made off to the bank with your wallet in hand. But that’s the nature of this industry. It’s a fork in the road with no signage; you either go left or right, you either win or lose, make or break. How do you know which way to choose?
If you ask true Forex Experts, they will always tell you the same thing, “NOBODY knows where the market is going, at best we’re all just guessing, the man with the better guess wins.”
But is that always true? Are there actually folks who know where the market is going the majority of the time? Folks who trade markets like Kobe played basketball, or Tiger played golf? Not perfect, but so damn good it’s hard for them to lose over the long run. People who build their legacy by hitting their winners more often and bigger than the rest of those wishful losers along the wayside?
The $15 Million Man
One of those very men is a man by the name of Ed Seykota. Ed got his start as a trader back in the 1960s and experienced (you guessed it) big losses like any other trader would when they start. Heres a small story in his own words.
In the late 1960s, I decided that silver had to rise when the U.S. Treasury stopped selling it. I opened a commodity margin account to take full advantage of my insight. While I was waiting, my broker convinced me to short some copper. I soon got stopped out and lost some money and my trading virginity. So I went back to waiting for the start of the big, inevitable bull market in silver. Finally, the day arrived. I bought. Much to my amazement and financial detriment, the price started falling! At first, it seemed impossible to me that silver could fall on such a bullish deal. Yet the price was falling and that was a fact. Soon my stop got hit. This was a very stunning education about the way markets discount news. I became more and more fascinated with how markets work. About that time, I saw a letter published by Richard Donchian, which implied that a purely mechanical trend following system could beat the markets. This too seemed impossible to me. So I wrote computer programs (on punch cards in those days) to test the theories. Amazingly, his theories tested true.
In other words, Ed found a system of trading that works. This system allowed Ed to turn $5,000 into $15,000,000 over 12 years. Systems are best applied when they are followed. The issue with most traders and people, in general, is that they follow their emotions before they follow a system that is tried and true. They see a “bad market day,” or a trade that’s in some drawdown and exit too early or too late or hell, they enter at the wrong time because they want quick money. Ed did money slow and it worked.
Trend Spotting 101
There are a million ways in which a trader can go wrong and very few ways in which a trader can go right. Ed had simply identified the fork in the road and placed a sign on it that states “Profits this way!”
That road is called “Trend Following.” At some point or another, most traders have heard the saying, “ The Trend Is Your Friend Until the Bend At The End.” But how many of those very same traders heed to that system? How many traders trade against the trend? That’s like taking a swim out into the ocean and trying your very hardest to swim against the current. Good luck, I have yet to meet one person strong enough to swim against the current. The ocean always wins.
But how do you spot a trend? It’s probably one of the most simple things you could ever learn as a trader, and one of the most powerful price predicting tools in your toolkit. “Charles Faulkner (trader, author, and NLP Expert) tells a story about Seykota’s finely honed intuition when it comes to trading:
‘I am reminded of an experience that Ed Seykota shared with a group. He said that when he looks at a market, that everyone else thinks has exhausted its uptrend, that is often when he likes to get in. When I asked him how he made this determination, he said he just puts the chart on the other side of the room and if it looked like it was going up, then he would buy it…’”
It’s that simple, but to spot a trend, you’ve got to look at the Higher timeframes, like the weekly, monthly and even yearly candles for older assets or pairs.
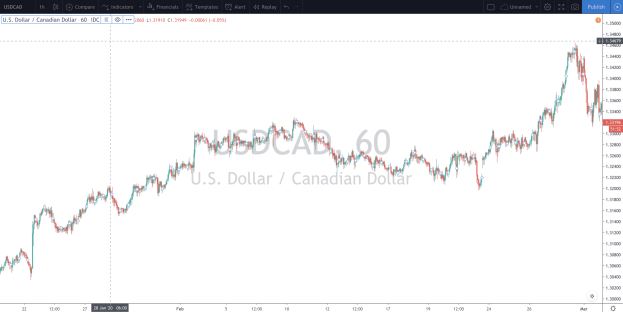
Here are a few examples. If I look at the USD/CAD (US. Dollar Vs. Canadian Dollar) on the hourly chart it very much looks like we are on the way up and for short term traders, people looking to make small swing trades, that’s okay
However, if you look at the chart below, which is the monthly USD/CAD pairing, you can see that it’s at a major key resistance from its all-time highs back in 2002. And to see that, all you
have to do is draw a line as best as you can between two of the highest points on the graph. You can see that they constitute a trend: A series of at least two points or more on a graph from its lows or highs. In the example below, we have this pair in a major downtrend or a series of lower highs and it’s just about to reach that point again.
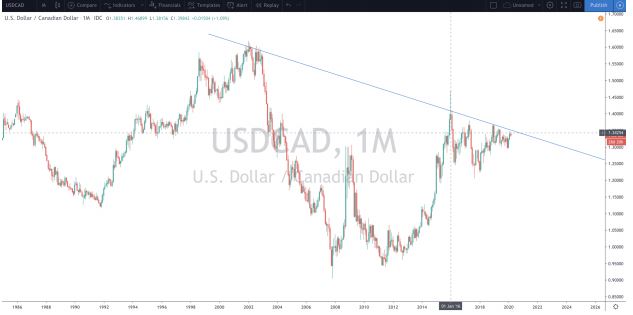
Ps. Ignore the long wick on January 16th in this example, the price couldn’t close above the trend because there was major sell-off to stay within that trend, which was a major indicator that the bears were in control and that led to a subsequent 15% drop in price.
One more example: In the AUD/USD pairing (Australian Dollar Vs. US Dollar) if you look at the hourly chart, you can easily see that this thing is in a downtrend.
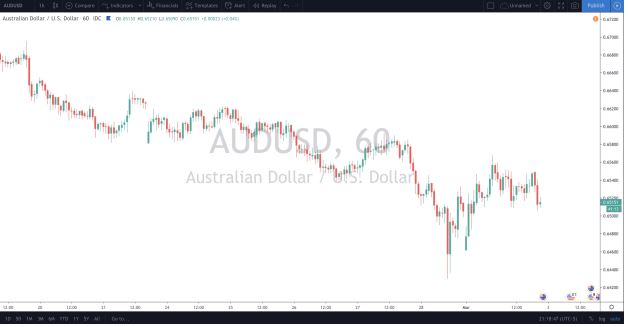
Let’s, however, confirm that idea by zooming out at price action over the years. The chart below is the very same pair on a weekly time-frame dating back to 2011.
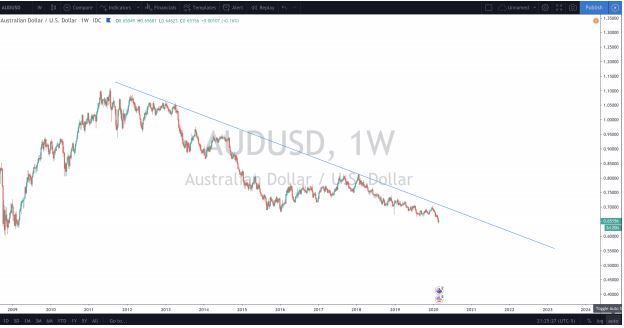
As you can see, this pair is caught in a major downtrend and hasn’t been seen a breakout just yet until it crossed the blue line drawn above which touches two of the highest point on the chart. In other words, if you’re trading smaller timeframes, then your strategy might be different, but if you want to be a position trader and hold trades over a longer period like weeks or months, I wouldn’t be betting against the trend too heavily.
Quite the opposite. This strategy requires a bit of patience, however, I would wait for the price to reach the top of the trend, then I would shoot the market and just hold that position until you see the trend start to break above that line for a new Higher High on the price indicating a trend reversal.
How To Spot a Trend Reversal
If you want to spot a Trend Reversal, I think it’s easiest to look at Priceline instead of candles because you’ll see one continuous line in it’s up and downs, Then you go ahead and look at history, draw your trend line, which should look something like this: Weekly AUD/USD Pair going back to the ’80s.
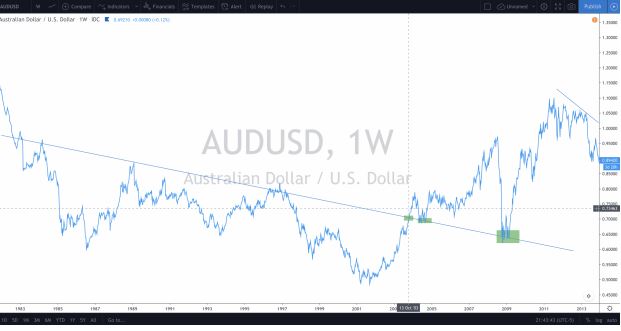
If you look closely, you can see that on October 13th of 2003, the line broke through the downtrend. And to Confirm that this was seriously a new upwards trend, in May through August of 2004, Price had tested that extended line 3 separate times before climbing up over 40%. It tested that very same line when you extend it further, in October of 2008 before making another leg up 77% to the highs we saw before the trend broke down. (dates mentioned in this paragraph are denoted in the photo with green boxes).
How do we know the Upward Trend had been broken? Simple, once you know we’re in an upward trend because that old “resistance line” just became a “support line” and you can see price bouncing off that line, you look to draw a new line that follows the lowest points on the new upward trend like the image below.

From this picture, you can see that the trend lasted a little over two years before being broken. Then on January 23rd of 2012, Price couldn’t climb any higher than the line it broke down below, signaling to investors that they needed to sell. Sell they did, and we’ve seen a sell-off of 40% down to current market lows we experience today in this pair.
I understand this stuff can get a bit confusing at times and if you need any help or have any questions, be sure to reach out by Clicking Here and we can set up a 100% Free to you Consult Call (literally no strings attached, no money involved) we just want to build good-will and build out fanbase.
Also, it’s important to note this trend-chasing strategy works best on higher timeframes, while at the same time requiring lots of patience and discipline in your investing. But, historically speaking here, it’s also proven to provide the highest returns over the longest periods. In other words, the wealthiest traders and investors are the ones who look for Macro moves, make fewer bets and stick to their guns.
Hope this article helped, if you want more info, Download my newly released book titled: In the Money – Forex Trading Secrets From a High School Dropout


